The instantaneous reading of rate of climb (ups) or rate of descent (downs) is shown on a bar graph "analogue" display.
You can use the Menu to choose to have heights indicated in metres or in feet.
There are five LCD bars in each marked division on the analogue display. When working in metres, each numbered division (five analogue bars) on the analogue display represents 1 m/s (metre per second). When working in feet, each division represents 200 fpm (feet per minute). As near as makes no difference (i.e. to within less than 2%), a metre per second is 200 feet per minute, so a 2-up shown means the same rate of climb whether the unit is set for metres or feet. So 4-up = 4 m/s = 800 fpm irrespective of units chosen (4-up = 14 km/h = 9 mph, if interested).
Note that there is a gotcha here:
When set for showing height in metres, the digital readout and the analogue readout read the same (metres per second for both). For example, in a steady 2-up the analogue display would show 2-up, and once it had settled the digital display would show 2.0 (both indicating 2m/s).
When set for showing height in feet, the digital readout shows twice that shown on the analogue readout, because the analogue readout shows fpm/200, but the digital display shows fpm/100. For example, in a steady 2-up the analogue display would show 2-up (2x200 = 400fpm), and once it had settled the digital display would show 4.0 (4x100 = 400fpm).
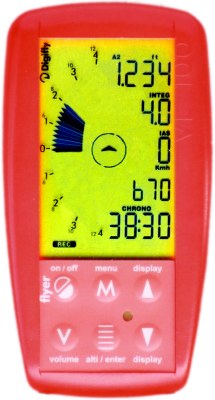
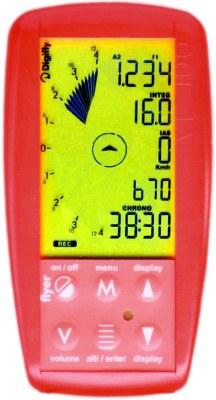
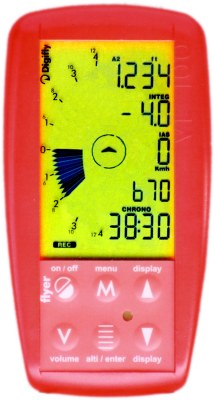
From zero to 4-up, the display fills up in the way that you would expect. But then to show further rates of climb, up to 12-up, the bar graph display clears from the bottom, at half the rate that it filled up, i.e. one major section for every two ups.
See the following screen shots:
Note that when showing heights in feet, if in steady climb or sink the digital (averaged) display reading will be twice that on the analogue display - see beginning of this section.
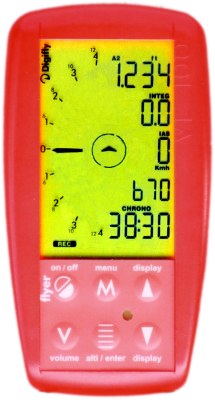
Bar graph fills up to the top.
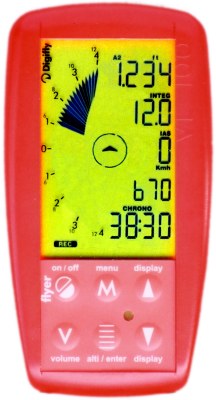
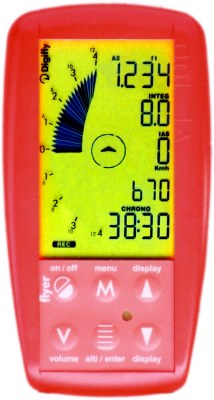
Past 4-up, the bar graph begins to clear from the bottom at half the rate it filled up – one section for every two ups.
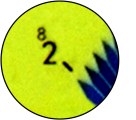 |
Yes, this is what those little digits on the display mean that you have been wondering about since you first bought the unit. In this detail example (left), the big 2 means this is the point for 2-up when it fills to this point. The little 8 means this is the point for 8-up when it clears to this point. |
The displays for rate of descent work in the same way but the other way up:
None of this is rocket science but it is not mentioned at all in the Digifly documentation, and while caught in an 8-up is not a good time to be trying to work it out.
| < home | disclaimer and copyright | next > |